Why Calorie Apps Overcount Vegetables (And How to Fix It)
Why calorie apps drift on vegetables — peer-reviewed research on database errors and oil absorption, the 7-step logging playbook for accurate AU vegetable tracking, and why the AFCD beats USDA for Australian produce.
Dr. Maya Patel
Registered Dietitian, M.S. Nutrition Science
Most crowdsourced calorie apps store vegetables as a tangled mix of raw, cooked, with-fat, and water-loss variants — a 2018 USDA validation found weight estimates differed significantly for 80 percent of foods tested, and onion entries swung by 103 percent. Pair that with a 2024 University of Sydney study that put AI app energy errors at 49 percent for mixed dishes, and the picture is clear: vegetables are the single biggest accuracy hole in everyday food tracking. This guide shows where the gap comes from and how to close it.
The reason vegetables sit at the centre of this problem is that they shapeshift between the pantry and the plate. A 100 g raw zucchini and a 100 g sautéed zucchini are not the same food: water leaves, oil enters, and the database entry you tap inside MyFitnessPal, Lose It!, or any free crowdsourced app may match neither. Most tracker users do not weigh vegetables, do not check raw versus cooked, and quietly accept whichever entry sits at the top of the search list — which is exactly how a daily veggie log drifts 200 to 400 kJ off in either direction. This guide unpacks the published research on app accuracy, where vegetables are most affected, and how to log them inside an 8,700 kJ AU day without obsessing.
The evidence below pulls from three peer-reviewed studies — Partridge and colleagues in Nutrients (2018), Chen and colleagues at the University of Sydney in Nutrients (2024), and Evenepoel and colleagues in the Journal of Medical Internet Research (2020) — plus the Food Standards Australia New Zealand (FSANZ) Australian Food Composition Database (AFCD), formerly NUTTAB, and the FSANZ Nutrition Panel Calculator reference set.
Do calorie apps actually overcount vegetables?
A 2018 USDA validation of 35 foods found significant weight differences in 80 percent of cases, with calorie estimates running from negative 103 percent for sliced onions to positive 39 percent for shredded cheese. Crowdsourced apps add another 15 to 30 percent variance across duplicate entries for the same food.
Partridge and colleagues at the Fred Hutchinson Cancer Research Center ran the 2018 study published in Nutrients that is still the cleanest look at the database side of the problem. The team measured 35 foods in standardised half-cup portions across six food categories, then compared the trial weights against USDA Standard Reference database weights and the resulting macro values. The headline: 80 percent of foods showed statistically significant weight differences, 78 percent showed significant calorie differences, and the spread ran from a 103 percent underestimate for sliced onions to a 39 percent overestimate for shredded cheese. Iceberg lettuce, sweet corn, and potatoes (French fries) all sat in the significant-error camp.
The University of Sydney's 2024 study added the app layer on top of the database layer. Chen, Li, Yin, Choi and colleagues screened 800 apps, evaluated 18, and tested each against Western, Asian, and Australian Dietary Guideline meal plans. Manual food-logging apps overestimated the Western diet energy by 1,040 kJ a day on average, underestimated the Asian diet by 1,520 kJ, and underestimated the AU-recommended diet by 944 kJ. AI-enabled apps overestimated beef pho calories by 49 percent and underestimated bubble tea by up to 76 percent. The cultural-coverage gap matters, but the day-level drift of 944 to 1,520 kJ matters more for anyone tracking against 8,700 kJ.
| Study | Method | Key vegetable-relevant finding |
| Partridge 2018 (Nutrients) | 35 USDA foods, weighed vs database | 80% had significant weight error; onion entry off by 103% |
| Chen 2024 (Sydney, Nutrients) | 18 apps, three meal plans | Manual apps drifted 944–1,520 kJ/day vs reference |
| Evenepoel 2020 (JMIR) | MyFitnessPal vs Nubel, 50 users | Underestimated protein 7.8%, carbs 6.4%, fat 1.7% |
Why do vegetables get miscounted more than meat or grains?
Vegetables get miscounted more than meat or grains for four interlocking reasons: water content shifts during cooking (so the gram weight changes), the same entry name covers raw, steamed, and pan-fried states with very different fat content, generic crowdsourced entries vary by 15 to 30 percent for the same food, and most users skip weighing because vegetables feel low-stakes.
Meat is dense and habit-forming: a 200 g chicken breast is recognisably a 200 g chicken breast, and most apps converge on roughly the same value. Grains are pre-portioned in cups, slices, and pieces that anchor the estimate. Vegetables have none of that. Spinach loses roughly 90 percent of its weight when wilted; broccoli loses 10 to 20 percent when steamed; potatoes pick up 8 to 12 percent of their weight in absorbed oil when roasted. If the database entry assumes raw and you cooked, or assumes "with oil" and you steamed, the kilojoule number cannot be right.
The Partridge study quantified this directly. Among the vegetables tested, sliced onions showed the largest density mismatch: a half-cup of trial-weighed onions weighed substantially more than the USDA half-cup estimate, pushing the calorie value off by 103 percent in the underestimate direction. The pattern repeats for any vegetable where shape and density vary widely — chopped versus sliced, fresh versus stored, leafy versus stem.
Crowdsourced apps then layer on a second error. A single search for "broccoli, steamed" inside MyFitnessPal returns dozens of generic entries with kilojoule values that can disagree by 15 to 30 percent. The Evenepoel 2020 validation against Belgium's Nubel reference database found strong overall energy correlation (r = 0.96) but consistent underestimation of protein (7.8 percent), carbohydrate (6.4 percent), and fat (1.7 percent) — and the team flagged that generic items including vegetables needed manual pre-registration to avoid the noisy entries skewing the dataset.
Here is the mechanism written out, with the typical magnitudes:
For a closer look at where AI food recognition meets these same shape problems, the how KCALM AI food recognition works explainer covers vision-side portion estimation, and the AI vs manual calorie tracking comparison shows the trade-offs across logging methods.
Which vegetables get miscounted most often?
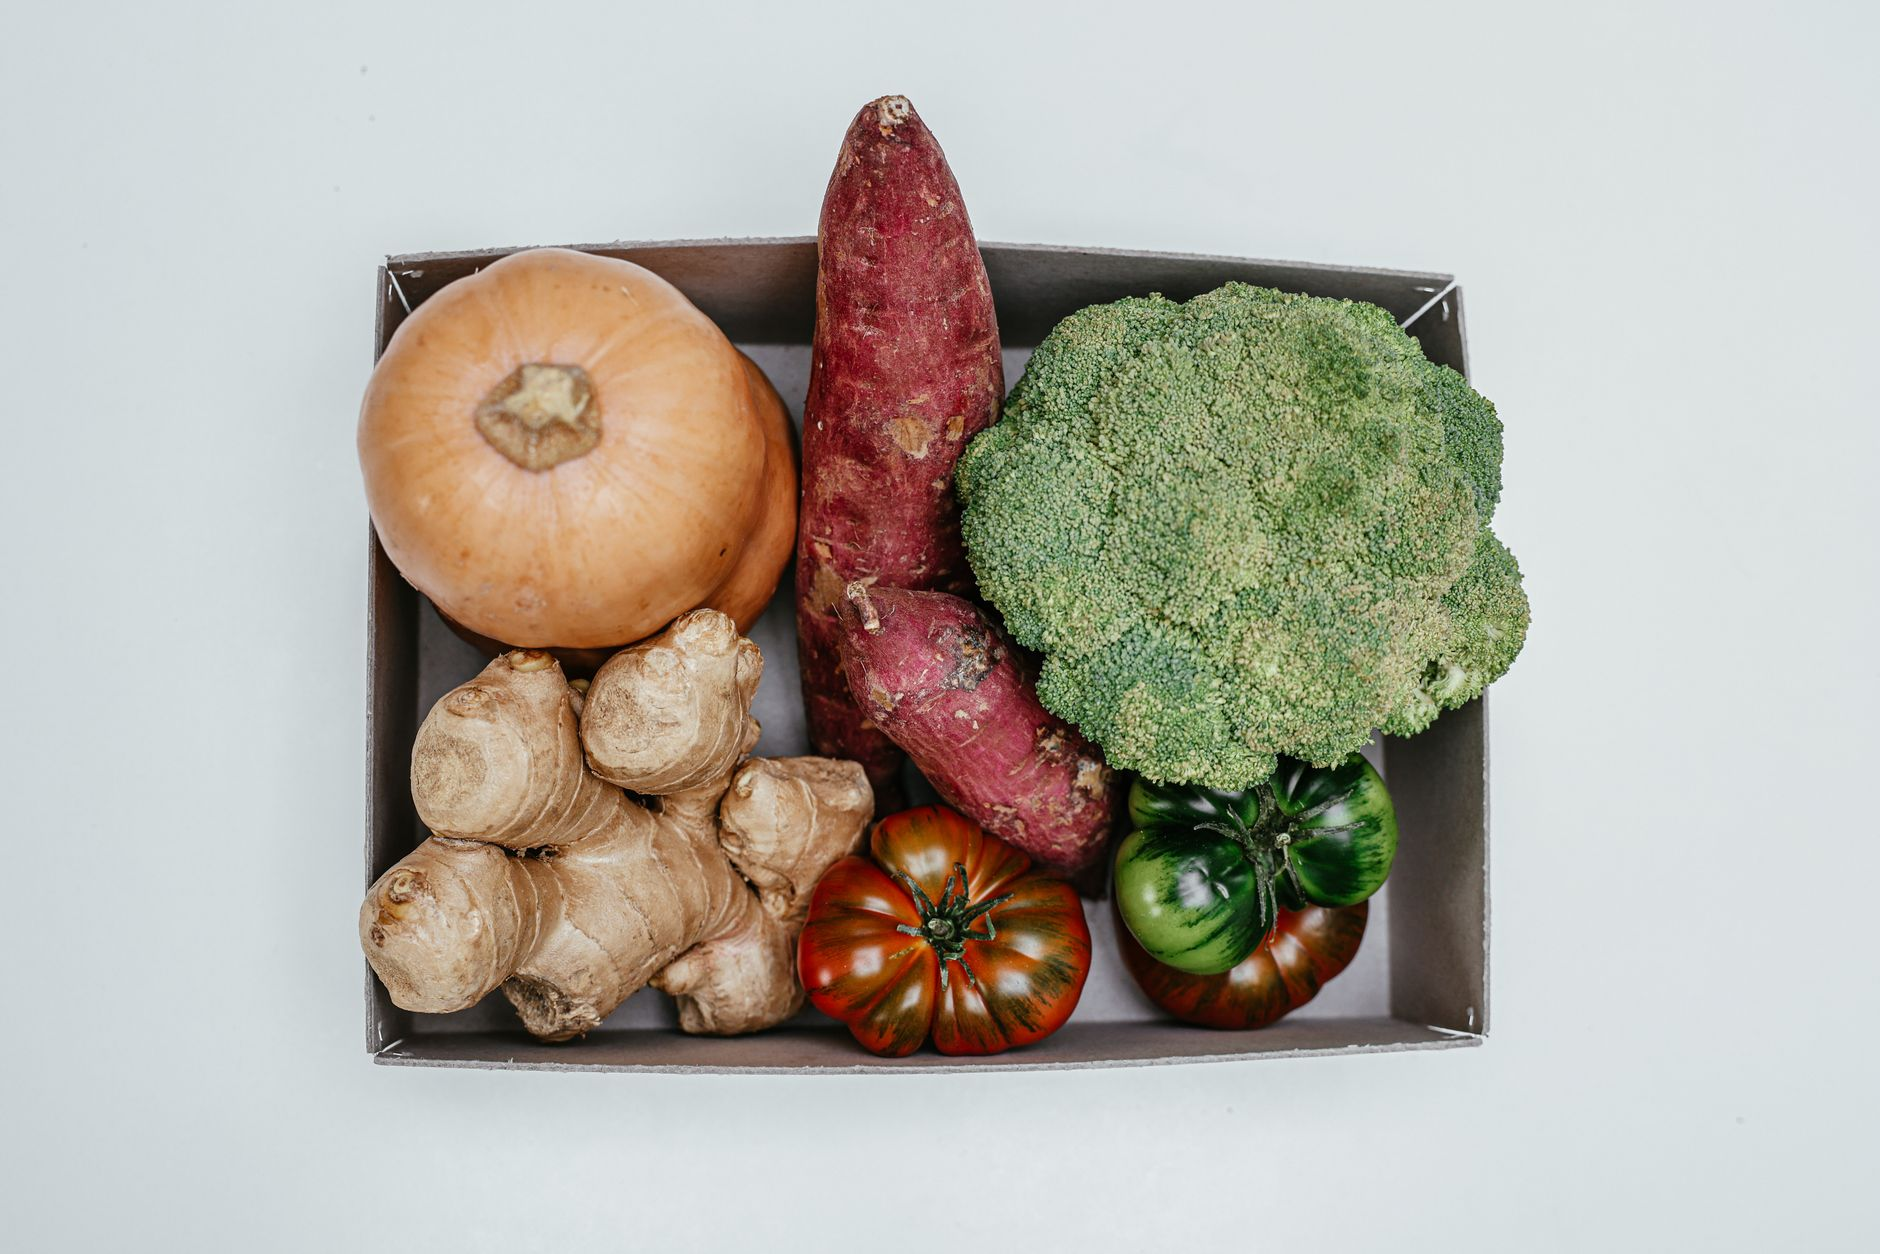
Leafy greens, roasted root vegetables, mixed stir-fry vegetables, and high-water vegetables (cucumber, zucchini, tomato) carry the largest log-versus-actual gaps. Leafy greens drift because of cooked weight loss, roasted roots because of added oil absorption, stir-fries because of mixed ingredients the AI cannot separate, and high-water vegetables because the database entry rarely matches the produce state on the bench.
Below is a working catalogue of the vegetables that show the widest gap between a typical app entry and the cooked-on-plate reality, drawing on AFCD reference values, USDA Standard Reference values, and the Partridge 2018 spread. The kJ-per-100 g figures below come from AFCD reference data; the "typical app drift" column is the direction and magnitude most consistently seen across crowdsourced entries in MyFitnessPal, Lose It!, and FatSecret.
| Vegetable | Raw kJ/100 g (AFCD) | Cooked kJ/100 g (AFCD) | Typical app drift | Underlying cause |
| Baby spinach | 100 | 100 (boiled) | Over by 200–400% when raw logged as cooked | 90% weight loss when wilted |
| Broccoli florets | 145 | 145 (steamed) | Over by 10–20% | Shape and density variance |
| White potato | 320 | 380 (roasted, fat) | Under by 20–30% | Oil absorption not captured |
| Sweet potato | 365 | 415 (roasted, fat) | Under by 15–25% | Oil absorption not captured |
| Zucchini | 70 | 75 (boiled) | Over by 50–80% | High water loss, low base kJ amplifies error |
| Iceberg lettuce | 60 | n/a | Over by 30–40% | Density mismatch (Partridge) |
| Sliced onion | 165 | 175 (boiled) | Under by up to 100% | Cup-volume mismatch (Partridge) |
| Tomato | 75 | 95 (stewed) | Over by 20–35% | Generic entries inflated |
| Mixed Asian stir-fry vegetables | 100 | 200 (fried, oil) | Under by 40–60% | AI cannot isolate added oil |
| Frozen mixed vegetables | 120 | 165 (boiled, fat) | Over by 10–25% | Salted or buttered preparations |
If you eat out at AU chains, the AU chain restaurant calorie database covers the chain-side estimation gaps in equivalent detail.
How can you log vegetables more accurately?
Logging vegetables accurately means matching the database entry to the cooked state on the plate, weighing where you can, logging the added oil as a separate ingredient, and preferring databases with analysed data over crowdsourced entries. For an Australian tracker, that usually means choosing AFCD-derived entries (NUTTAB) over USDA-derived entries and using "added during cooking" lines for oil and butter.
This is the practical playbook. None of it requires obsessing — a 30-second routine for the high-impact meals (dinner, prepped lunches) closes most of the gap on its own.
The getting started with calorie tracking guide covers the first-five-meals routine, and the calorie tracking versus intuitive eating write-up is a useful follow-on if the accuracy chase is starting to feel heavy.
Why does the AU database matter for Australian users?
The Australian Food Composition Database (AFCD), formerly NUTTAB, currently lists 1,588 foods commonly available in Australia with up to 268 nutrients per food, with most values directly analysed rather than imputed. Apps using USDA entries for Australian produce can miss kilojoule values by 5 to 15 percent because cultivar, soil, and storage differ between AU and US supply chains.
FSANZ published the most recent AFCD release in May 2026. The dataset includes a dedicated horticultural commodities expansion that added nearly 9,000 values across 56 vegetables, including raw and cooked (boiled, baked, fried-without-fat) preparations. That is the AU-specific reference data your tracking app may benefit from pulling from. Most consumer apps default to USDA SR because it is larger and easier to license — fine for a Caesar salad in California, less fine for a roast pumpkin in Adelaide.
The Nutrition Panel Calculator (NPC), which FSANZ provides for AU manufacturers, uses AFCD reference values to build the nutrition information panel that ends up on AU supermarket packaging. So the kilojoule figure on a Coles or Woolworths product is anchored to AFCD, not USDA. If your tracking app is anchored to USDA, the math drifts on every AU-grown produce log.
The NUTTAB vs USDA Australian calorie tracking accuracy guide unpacks the database mismatch in detail and lists the apps that ship with AFCD coverage out of the box.
Frequently Asked Questions
How much can vegetable miscounting affect a daily kilojoule total?
Research suggests the daily drift sits between 200 and 1,500 kJ depending on how vegetable-heavy your day is and which database your app uses. The University of Sydney 2024 study put manual-app drift at 944 to 1,520 kJ across the three diets it tested. For an 8,700 kJ AU reference day, that is between 2 and 17 percent.
Is MyFitnessPal accurate for vegetables?
MyFitnessPal's energy correlation against analysed-database reference values is strong overall (r = 0.96 in the 2020 Evenepoel validation), but the crowdsourced vegetable entries vary by 15 to 30 percent between duplicates. The app is usable for vegetables if you pre-register a small set of custom entries you trust and avoid the first-result generic options.
Does AI photo logging fix the vegetable problem?
Not yet, fully. The University of Sydney 2024 study found AI apps still struggle with mixed dishes — beef pho was overestimated by 49 percent — and portion estimation remains the largest single error source. AI tends to do better on plate-separated Western foods like grilled chicken with steamed broccoli than on stir-fries or mixed bowls.
Should I log raw or cooked vegetable weights?
Match the database entry. If you choose a "raw" entry, weigh raw; if you choose "cooked," weigh cooked. The most consistent move is to weigh cooked and pick a cooked entry, because that is the state actually on your plate and it captures any oil absorbed during roasting or frying.
Are Australian vegetable calorie databases more accurate than US ones for AU produce?
Generally, yes, for AU-grown produce. The AFCD release contains nearly 9,000 directly analysed values for AU vegetables, including raw and cooked variants, calibrated against Australian cultivars, soils, and storage. USDA SR is excellent for US-grown produce but uses different reference samples, so the kilojoule figure for an AU zucchini may differ by 5 to 15 percent from the closest USDA entry.
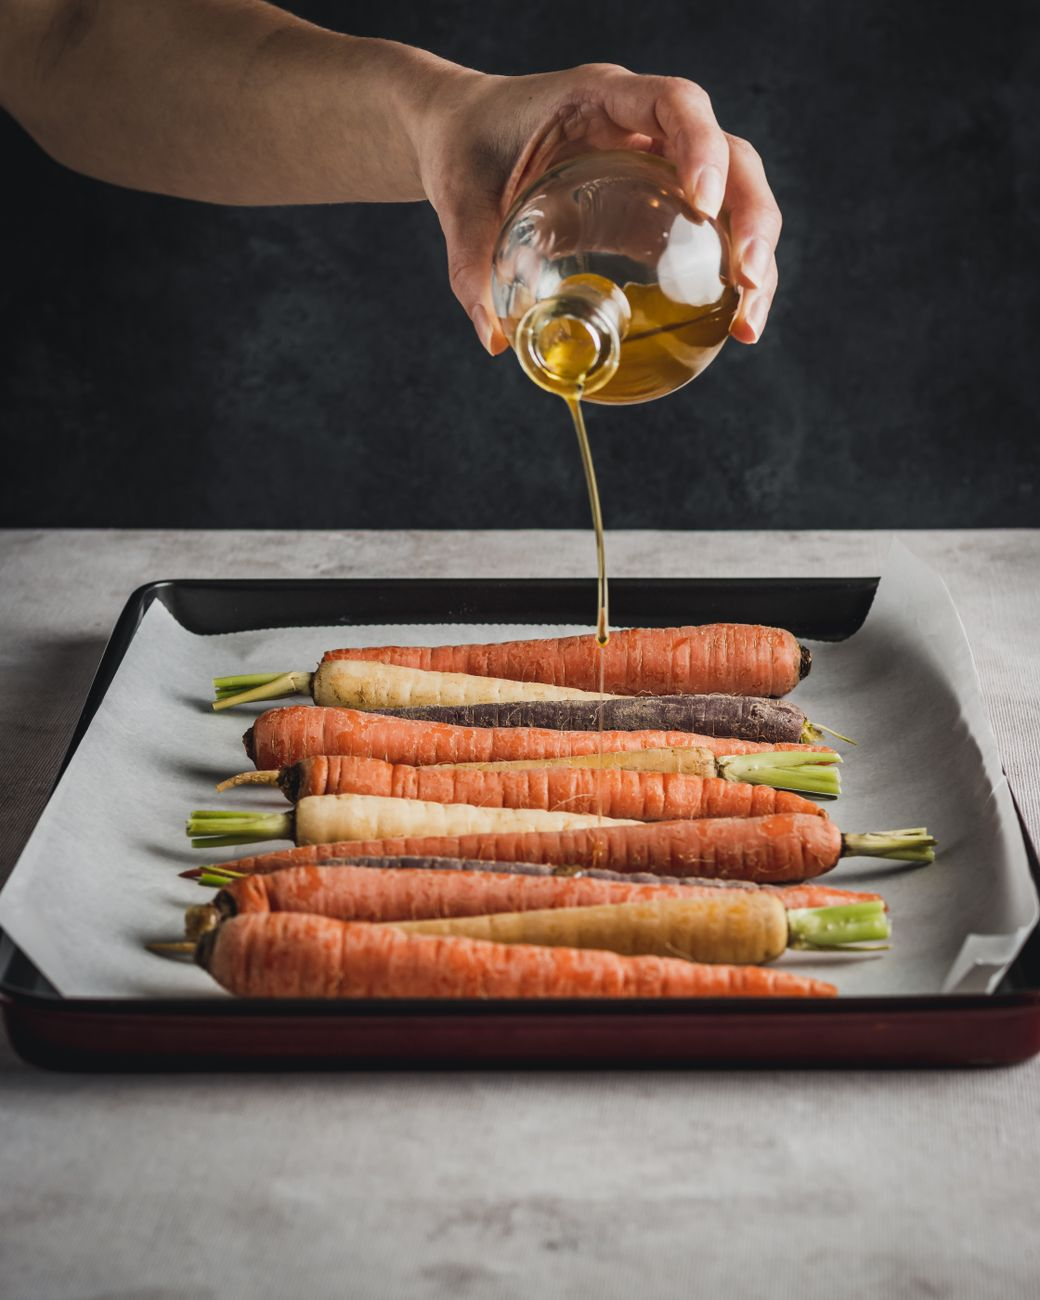
How much does added oil during cooking actually change vegetable kilojoules?
A typical roast of mixed vegetables uses 10 to 20 g of olive oil across a 600 g serve weight, which adds 370 to 740 kJ on top of the vegetable base. That is the single largest preventable error in vegetable logging — and the easiest to fix by adding the oil as a separate ingredient line.
Sources
Ready to track smarter?
Join thousands who use KCALM for calorie tracking. AI-powered food recognition, scientifically-validated calculations, and zero anxiety.
Related Articles
HelloFresh AU Calories: Recipe Labels vs Actual 2026
Verified kilojoule, protein, and sodium figures for HelloFresh Australia recipes in 2026, what 346-recipe and 36-meal AU studies reveal about labelled vs as-cooked accuracy, and a five-rule playbook for tracking HelloFresh meals inside an 8,700 kJ day.
NutritionColes vs Woolworths Ready Meals: AU Calorie Database 2026
Verified kilojoule, protein, and sodium figures for Coles and Woolworths frozen and chilled ready meals in 2026, plus what 631-meal AU research reveals about Health Star Ratings, salt, and what actually feeds a fat-loss plan.
NutritionSchooner, Pint, Pot, Middy: AU Beer Calorie Guide 2026
Verified kilojoule and calorie figures for a schooner, pint, pot, middy, and jug of Australian beer at full strength, mid strength, and light, with state-by-state naming and how to track them in a calorie app.